Co-folding models ship a confidence score with every predicted pose, and practitioners use it as an accept/reject criterion. Choosing a threshold on that score is a claim that the error rate among accepted predictions is acceptable. We asked whether that claim holds when the target is unlike anything in the model’s training window.
Calibrate a threshold the standard way and it delivers the 10% error rate you asked for. Split the same result by how similar each target is to the model’s training data, and the guarantee is carried entirely by the familiar cases.
| Pocket similarity to nearest pre-cutoff system | Realised error at a 10% target |
|---|---|
| 0 to 30 (unlike anything in training) | 35.8%, 3.6x the target. Violates in 86% of splits. |
| 30 to 60 | 21.3%, 2.1x the target. Violates in 95% of splits. |
| 60 to 90 | 7.6%. Within target. |
| 90 to 100 (near-identical pocket) | 2.9%. Far inside target. |
| Pooled | 10.1%. On target. |
The full write-up is in the paper. The data, calibration outputs, and every script that regenerates the figures are at github.com/fonsResearch/fons-bench.
What was measured
Given a model’s own confidence signal, at what threshold can you guarantee the error rate among accepted predictions stays below a target α, and does that guarantee survive distribution shift?
The evidence is the Runs N’ Poses release: 2,600 high-resolution protein–ligand systems released after the co-folding training cutoffs, predicted by AlphaFold 3, Boltz-1, Boltz-1x, Boltz-2, Chai-1, Protenix and RoseTTAFold All-Atom. After filtering, the analysis covers 568,220 predictions over 2,448 systems.
Three choices define the analysis.
The label is uniform. A prediction is correct when its binding-site-superposed, symmetry-corrected ligand RMSD is below 2 Å. PoseBusters validity checks exist for only one pose per ligand and not at all for Boltz-2, so folding them into the label would make “correct” mean different things per model. Validity is kept as a secondary label.
The grain is the pose a practitioner receives. Each model produces 25 poses per ligand. We analyse the model’s own top-ranked pose, one per ligand, because that is what an accept/reject decision is actually applied to.
Similarity is recomputed per model. Each method has its own training cutoff. Chai-1’s is more than eight months earlier than the date the benchmark was built around, and Boltz-2’s is twenty months later, so a single global cutoff would misstate the shift for both. Each system’s similarity is computed against the nearest structure released before that model’s cutoff. RoseTTAFold All-Atom has no published cutoff and is excluded from all cutoff-dependent analysis rather than assigned a guessed date.
The shift coordinate is SuCOS-pocket similarity to the closest pre-cutoff system, binned at 0/30/60/90/100. Ligand ECFP4 Tanimoto is a secondary axis used as a robustness check.
Kill condition, committed in writing before any curve was drawn. If, within every shift bin, the best native confidence signal achieves normalised excess AURC ≤ 0.25 with a monotone risk–coverage curve and no material degradation across bins, then confidence signals already support selective prediction under shift and the central claim is dead.
It did not fire. No model cleared the threshold in all four bins, which is what the condition required: five of twenty-eight model–bin cells reach nE ≤ 0.25, and the best any model manages is two of four. Boltz-1x is the one case that clears it in the least-similar bin, at 0.195. The best signal is a chain-pair ipTM variant for every model, with normalised excess AURC from 0.204 (Boltz-2) to 0.558 (Protenix): informative, but far from sufficient. Dispersion of ipTM across the 25 samples performs essentially identically to the point signal, so sample disagreement adds little beyond the confidence value itself.
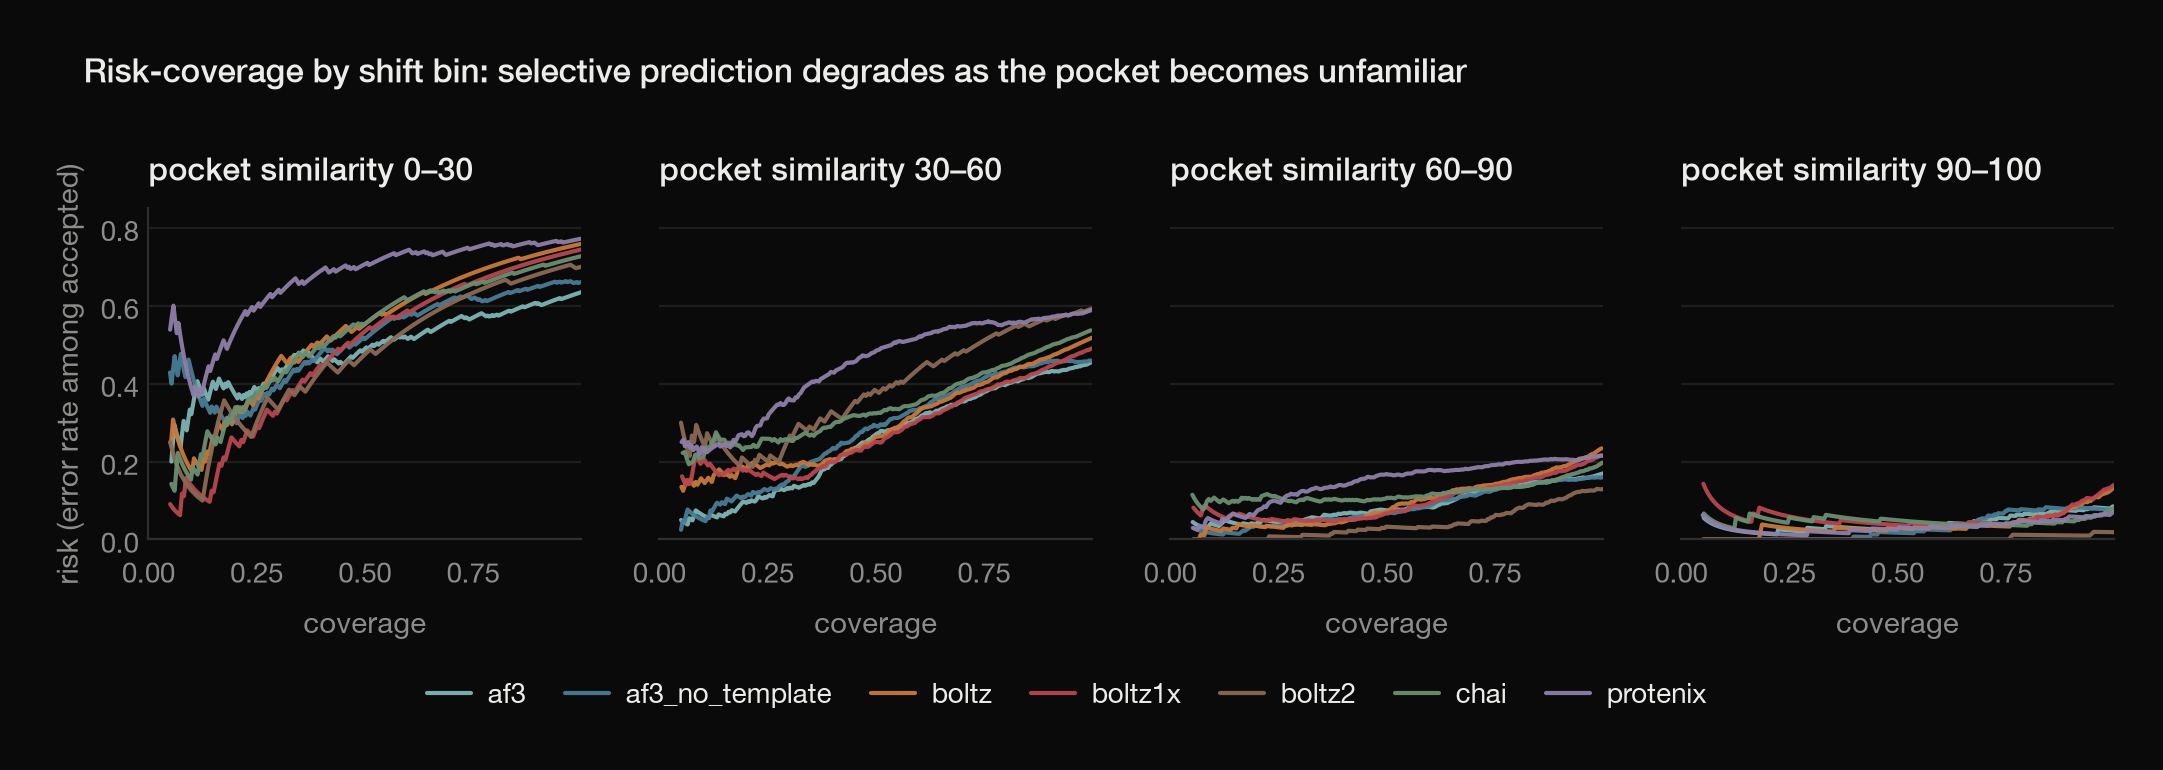
Risk against coverage, per model, by pocket similarity. Each curve is the model’s own best confidence signal. A signal that supported selective prediction would bend toward zero risk as coverage falls; in the least-similar bin none of them do.
Marginal calibration is valid on average and wrong where it counts
Split conformal risk control on a random calibration split is the standard recipe, and it works exactly as advertised in aggregate: 10.1% realised error against a 10% target, straddling α about half the time, which is what marginal validity in expectation looks like at finite sample. The pooled number is an average over a population whose difficulty spans an order of magnitude, and the easy majority pays for the hard minority.
Base error rate among top-ranked poses rises steeply as pocket similarity falls. For AlphaFold 3 it runs 0.635, 0.456, 0.170, 0.085 across the four bins; for Protenix 0.772, 0.588, 0.215, 0.072. A threshold calibrated on the pooled distribution inherits an error rate near 0.3 while the least-similar bin sits between 0.64 and 0.77.
Group-conditional (Mondrian) calibration fits a separate threshold inside each similarity bin. It restores the guarantee, in the only way available to it. In the least-similar bin at α = 0.1 it accepts nothing at all in 93% of splits. This is correct behaviour, not a failure: no threshold on this signal certifies this bin at this error rate with this much calibration data, so the method declines rather than issue one it cannot back. The alternative, borrowing a threshold from a better-populated bin, is precisely the marginal failure above.
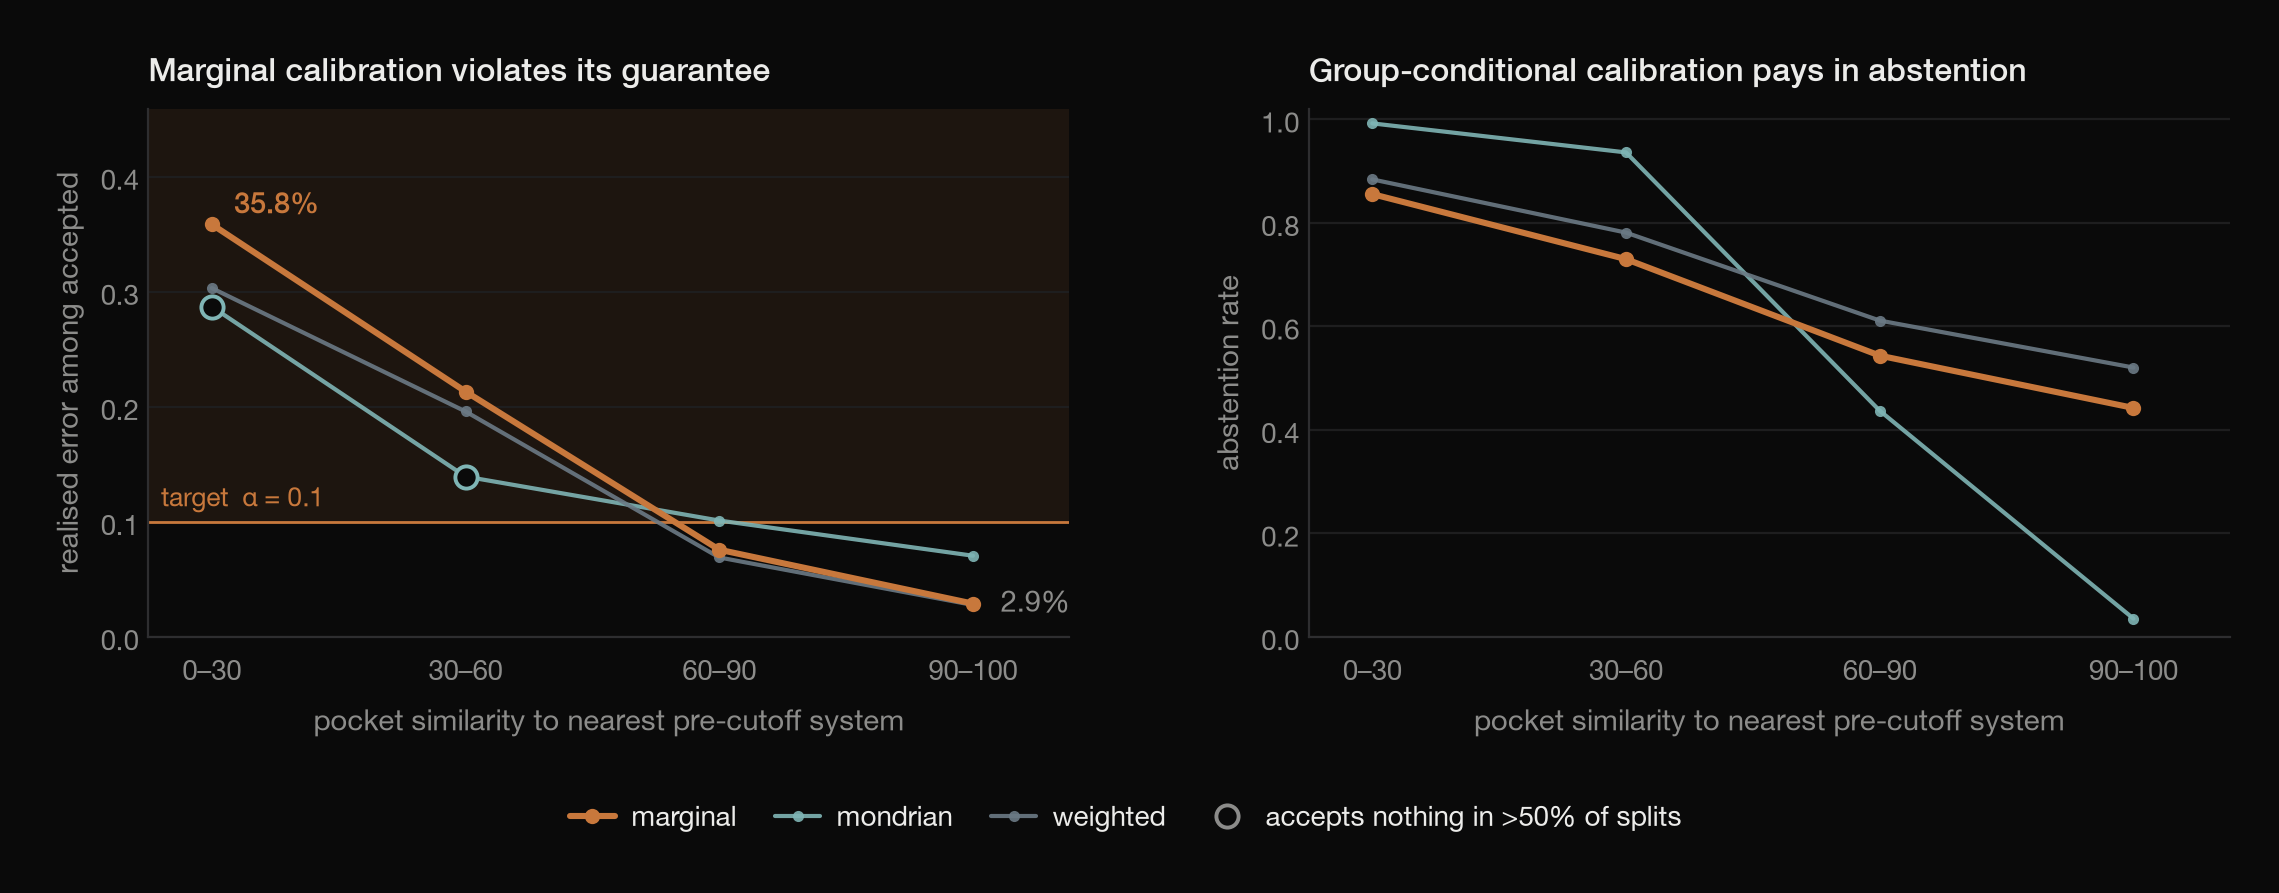
Realised error and abstention by pocket similarity, averaged over seven models and 50 random calibration/test splits. Hollow markers mark bins where the method accepts nothing in more than half of splits, so its error rate there is undefined rather than good.
Realised error, abstention, and how often each method declines entirely. α = 0.1, mean of 50 splits across seven models.
| Bin | Realised error | Abstention | Splits violating α | Splits accepting nothing |
|---|---|---|---|---|
| Marginal, one pooled threshold | ||||
| 0–30 | 0.358 | 0.855 | 86% | 6% |
| 30–60 | 0.213 | 0.730 | 95% | 2% |
| 60–90 | 0.076 | 0.543 | 15% | 2% |
| 90–100 | 0.029 | 0.442 | 0% | 2% |
| pooled | 0.101 | 0.613 | 53% | 2% |
| Mondrian, a threshold per bin | ||||
| 0–30 | 0.287* | 0.992 | 7% | 93% |
| 30–60 | 0.139* | 0.936 | 24% | 64% |
| 60–90 | 0.101 | 0.437 | 51% | 2% |
| 90–100 | 0.071 | 0.035 | 14% | 0% |
| Weighted, covariate-shift likelihood ratios | ||||
| 0–30 | 0.303 | 0.884 | 68% | 26% |
| 30–60 | 0.196 | 0.781 | 73% | 25% |
| 60–90 | 0.069 | 0.611 | 6% | 25% |
| 90–100 | 0.028 | 0.520 | 0% | 25% |
* Averaged over the minority of splits with a non-empty acceptance set. Not a coverage claim.
Weighted conformal sits between the two: it tightens thresholds under shift and reduces violation rates relative to marginal, but it applies one global threshold and so cannot deliver per-bin validity.
There is an asymmetry worth noting. Mondrian relaxes the threshold where the signal works well: in the 90–100 bin its abstention is 0.035 against marginal’s 0.442. The cost of conditional validity is per-bin, not aggregate, and pooling can even reduce total abstention while destroying the guarantee where it matters.
The failure is driven by pocket novelty, not ligand novelty
Repeating the identical protocol grouped on ligand similarity instead of pocket similarity reproduces the direction at roughly a third of the magnitude: marginal calibration realises 0.151 error in the least-similar ligand bin against 0.061 in the most-similar, versus 0.358 against 0.029 on the pocket axis. Both axes violate the guarantee, and violation frequency in the hardest bin is comparable, but the severity is not. An unfamiliar pocket degrades selective prediction far more than an unfamiliar ligand. This is consistent with the mechanism being pose memorisation rather than chemistry generalisation.
Buying the guarantee costs the whole acceptance budget
Relaxing the target does not buy back much. In the least-similar bin, marginal calibration misses its target at every level tested, by a factor of five at α = 0.05 and three at α = 0.10, narrowing to roughly twice the target by α = 0.4. Conditional calibration only starts accepting a meaningful share of cases once the target error rate is loosened past 30%, at which point the guarantee is no longer worth having.
Least-similar bin (pocket similarity 0 to 30) across target error rates. The right-hand column is the share of splits in which conditional calibration rejects every prediction. This sweep runs 20 splits per target level, against 50 for the single-α results above, so its α = 0.1 row reads 95% where the 50-split figure is 93%.
| Target α | Marginal realised error | Marginal abstention | Conditional abstention | Conditional accepts nothing |
|---|---|---|---|---|
| 0.05 | 0.264 | 0.969 | 0.999 | 99% |
| 0.10 | 0.351 | 0.858 | 0.994 | 95% |
| 0.20 | 0.465 | 0.634 | 0.954 | 59% |
| 0.30 | 0.664 | 0.202 | 0.880 | 31% |
| 0.40 | 0.711 | 0.001 | 0.760 | 9% |
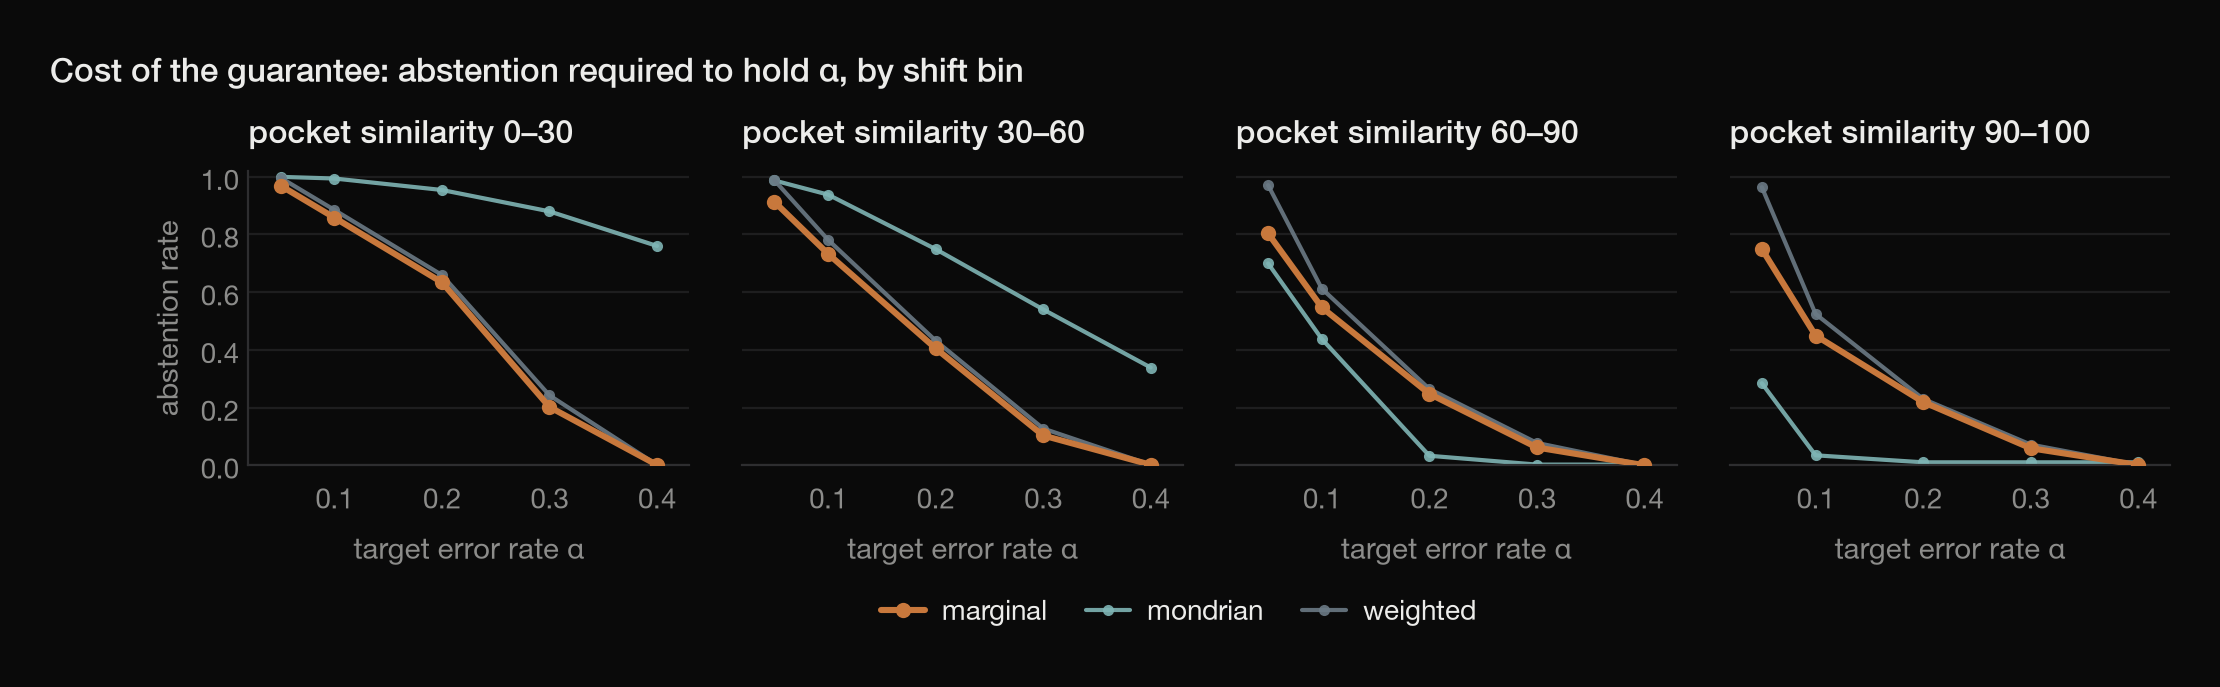
Abstention required to hold each target error rate, by bin and method. The familiar bins reach usable coverage quickly; the unfamiliar bin never does.
Headline accuracy is substantially memorisation
Benchmark accuracy computed on the full post-cutoff distribution is carried disproportionately by cases the model has effectively already seen. The ligand-similarity distribution has a hard mass point at Tanimoto 100: the identical ligand, in a different structure, released before the model’s cutoff.
- 27.5% of post-cutoff systems fall in that exact-match group.
- Accuracy there averages 0.841, against 0.615 on everything else.
- They supply 34.3% of all correct predictions.
- Excluding them and the next decile of ligand similarity, headline accuracy falls from 0.677 to 0.599.
Protenix depends on exact matches most, losing 0.103 accuracy; Boltz-2 least at 0.047, though Boltz-2 also has the smallest post-cutoff sample by a wide margin.
At matched abstention within the least-similar bin, AlphaFold 3 leads when little is discarded, but the ordering does not hold as abstention rises: by 75% abstention Boltz-1x is ahead, 0.864 against AlphaFold 3’s 0.643, on 22 to 55 accepted poses per model. The bin is too small to rank models at high abstention. The expensive models do not collapse on unfamiliar targets relative to each other. Whether they still beat cheap physics-based docking there is the more interesting question, and this release cannot answer it: no docking baseline is included.
What this means
The practical recommendation is not “use group-conditional calibration”. It is that a confidence threshold quoted without reference to the similarity between the target and the model’s training window is not a guarantee about anything. Where similarity is high, the signals work and calibration is easy. Where it is low, which is where a structure prediction is actually load-bearing, no threshold on the currently available signals certifies a useful error rate, and a calibration method that says so is behaving correctly. Reporting a single benchmark accuracy or a single calibrated threshold across a mixed-similarity population conceals this completely.
Limitations
Signal coverage. The source release ships scored CSVs rather than predicted structures, so only ranking scores and chain-pair ipTM variants could be tested. pLDDT, PAE and pTM are absent. If per-atom confidences rank correctness materially better than ipTM the quantitative picture would improve, though the conditional-coverage mechanism would not change.
RMSD verification. We re-implemented the release’s symmetry-corrected RMSD independently and verified it on 28 poses, over-weighting the 1 to 3 Å band where a disagreement could flip the label. 27 of 28 agree to within 1e-4 Å and no label flips across 2 Å. Reaching that agreement required searching over protein chain mappings: in homomeric complexes a greedy assignment superposes the binding site onto the wrong monomer and produces a ligand RMSD wrong by tens of Å while looking like a successful superposition.
Calibration set size. Mondrian’s near-total abstention in the least-similar bin is a joint property of the signal and the 110 to 141 calibration poses per model available there, and only 40 for Boltz-2. A larger benchmark could make some of those bins certifiable. What would not change is the marginal method’s violation, which is a property of pooling and not of sample size.
Code and data
Everything is at github.com/fonsResearch/fons-bench: the master table (568,220 rows, one per ligand, model, seed and sample), calibration thresholds for seven models at five target error rates, the figures, and every script that regenerates them. The master table is a build product rather than a stored file; one command reassembles it byte-identically from the source release.
The calibrated thresholds are a small JSON artifact in the repository, so scoring a new set of predictions needs neither a GPU nor the benchmark data:
uv run fons-bench evaluate --predictions my_preds.csv --model af3 --alpha 0.1Given a confidence signal and, optionally, the pocket similarity of each target to the nearest structure predating the model’s training cutoff, it applies both the marginal and the group-conditional rule and reports which bins it cannot certify rather than silently accepting in them.
The benchmark is designed to be re-run against future models. The shift coordinate is recomputed per model from its own training cutoff, so a model released with a later cutoff is scored on its own terms.
Derived from the Runs N’ Poses release (Zenodo record 18366081). Rows for AlphaFold 3 carry Google’s AlphaFold 3 Output Terms of Use (non-commercial).